The following content is translated from Chinese. Please refer to the original text to avoid errors. The link to the original text is:(中国)湖北省2024年国民经济和社会发展统计公报-红黑统计公报库
1. Comprehensive
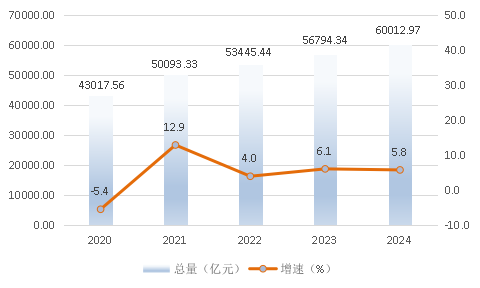
According to preliminary estimates, the province's gross domestic product (GDP) for 2024 is 6001.297 billion yuan, representing a 5.8% increase over the previous year when calculated at comparable prices. Specifically, the primary industry added value was 546.218 billion yuan, up 3.1%; the secondary industry added value was 2157.376 billion yuan, up 6.4%; and the tertiary industry added value was 3297.703 billion yuan, up 5.9%. The structure of the three industries has shifted from 8.9:36.5:54.6 in 2023 to 9.1:35.9:55.0. The annual per capita GDP was 102,832 yuan, up 5.9% over the previous year when calculated at comparable prices.
Figure 1: Provincial GDP and its growth rate from 2020 to 2024
The consumer price index for the year increased by 0.4% compared to the previous year. Specifically, urban prices rose by 0.5%, while rural prices increased by 0.2%. By category, food, tobacco, and alcohol prices rose by 0.4%, clothing prices by 2.8%, housing prices by 0.3%, daily necessities and services prices by 0.2%, transportation and communication prices by 1.7%, education, culture, and entertainment prices by 1.2%, medical and health care prices by 0.7%, and other goods and services prices by 4.2%. The producer price index for industrial producers decreased by 2.5%, and the purchase price index for industrial producers fell by 4.4%.
During the year, 1.7847 million new business entities were registered, an increase of 11.0% over the previous year. The number of business entities in the province reached 9.207 million, an increase of 10.6%.
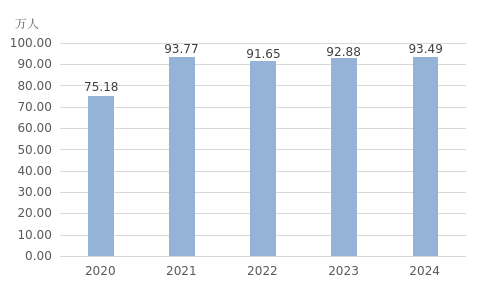
A total of 934,900 new urban jobs were created, exceeding the annual target. The surveyed urban unemployment rate in the province averaged 5.3%, down 0.1 percentage points from the previous year.
Figure 2 Number of new urban jobs in the province from 2020 to 2024
2. Agriculture
The added value of agriculture, forestry, animal husbandry and fishery in the province reached 589.114 billion yuan, an increase of 3.6% over the previous year.
The total grain planting area for the year was 4,722.61 thousand hectares, an increase of 15.64 thousand hectares from the previous year. Specifically, the rice planting area was 2,276.55 thousand hectares, up by 2.39 thousand hectares; the wheat planting area was 1,043.54 thousand hectares, up by 5.15 thousand hectares; the corn planting area was 765.46 thousand hectares, up by 0.15 thousand hectares; and the soybean planting area was 243.95 thousand hectares, up by 1.72 thousand hectares.
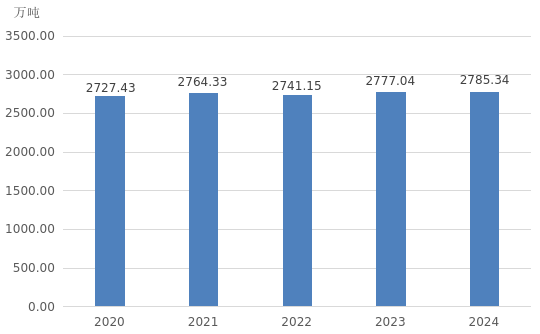
The total grain production for the year reached 27.8534 million tons, marking a 0.3% increase from the previous year. The grain output was 26.2490 million tons, up 0.24%. Specifically, the rice output was 18.8925 million tons, up 0.47%; the wheat output was 4.1047 million tons, up 0.01%; the corn output was 3.1524 million tons, down 0.93%. The soybean output was 429,200 tons, up 0.26%.
Figure 3 Provincial grain output from 2020 to 2024
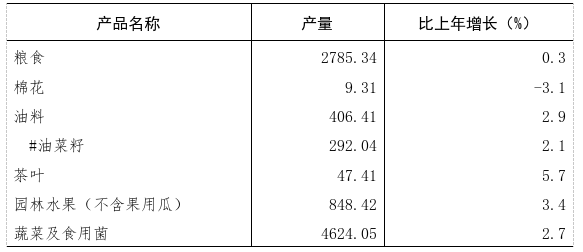
The annual output of oil was 4.0641 million tons, an increase of 2.9% over the previous year; tea output was 474,100 tons, an increase of 5.7%; garden fruit output was 8.4842 million tons, an increase of 3.4%; vegetable and edible fungus output was 46.2405 million tons, an increase of 2.7%.
The total production of pork, beef, mutton, and poultry meat for the year was 4.5252 million tons, a decrease of 1.0% from the previous year. Specifically, pork production reached 3.5120 million tons, up 1.1%; beef production was 160,200 tons, down 6.8%; mutton production was 96,200 tons, down 8.5%; poultry meat production was 756,800 tons, down 7.9%; and poultry egg production was 2.5159 million tons, up 16.3%. By the end of the year, the number of pigs in stock was 25.2069 million, a decrease of 2.9% from the previous year; the number of pigs slaughtered throughout the year was 44.3143 million, down 0.2% from the previous year.
The annual output of aquatic products was 5.4643 million tons, an increase of 4.5 percent over the previous year.
Table 1 Output of major agricultural products in the province in 2024
Unit: ten thousand tons
Industry and construction
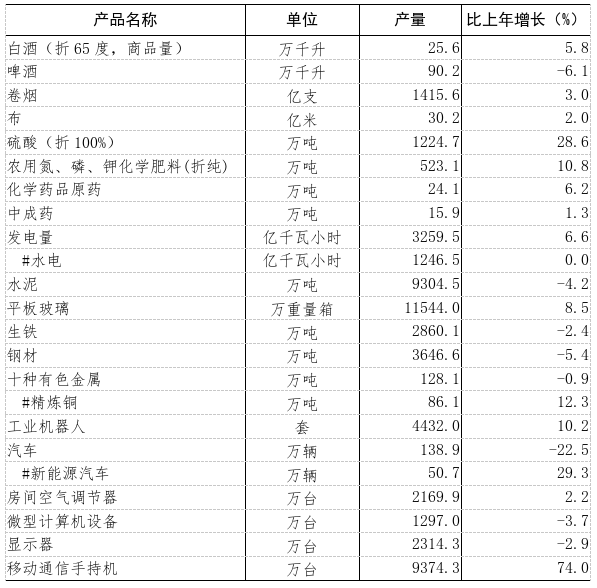
By the end of the year, the number of industrial enterprises above designated size in the province reached 19,916. The industrial added value of these enterprises increased by 7.7% compared to the previous year. By economic type, state-owned enterprises grew by 4.8%, shareholding enterprises by 8.9%, foreign-invested and Hong Kong, Macao, and Taiwan-funded enterprises by 0.3%, and private enterprises by 6.4%. The light industry grew by 5.9%, while the heavy industry grew by 8.5%. By sector, mining grew by 5.3%, manufacturing by 7.9%, and the production and supply of electricity, heat, gas, and water by 6.0%.
The added value of high-tech manufacturing increased by 22.7 percent over the previous year, accounting for 14.8 percent of the total industrial added value above designated size. Among them, the manufacturing of computers, communications and other electronic equipment grew by 24.3 percent.
The annual sales value of industrial enterprises above designated size increased by 4.9% over the previous year, the product sales rate was 94.62%, and the export delivery value increased by 7.3%. The profits of industrial enterprises above designated size reached 278.789 billion yuan, up by 25.9%.
Table 2 Output and growth rate of major products of industrial enterprises above designated size in the province in 2024
The total output value of construction enterprises with general contracting and professional contracting qualifications reached 2,197.377 billion yuan, an increase of 5.8% over the previous year; the newly signed contract value was 2,647.084 billion yuan, down by 2.5%.
4. Investment in fixed assets
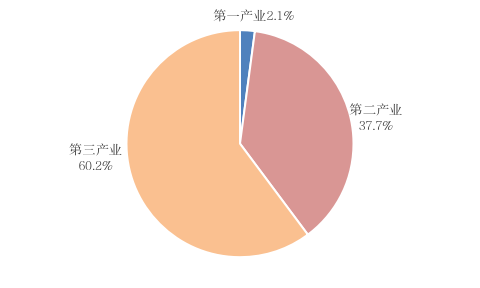
The province's fixed asset investment (excluding rural households) increased by 6.5% compared to the previous year. By industry, investments in primary, secondary, and tertiary sectors grew by 2.8%,14.7%, and 2.1%, respectively. In terms of sectors, industrial investment, infrastructure investment, and real estate development investment grew by 14.7%,9.8%, and-5.9%, respectively. The province has shown significant progress in innovation-driven development, with new drivers and advantages rapidly emerging. High-tech industry investment grew by 16.7%, including a 15.4% increase in high-tech manufacturing investment and a 20.5% increase in high-tech service industry investment. Efforts to address weaknesses and enhance functions have been accelerated, with investments in railway transportation and water conservancy management increasing by 23.4% and 60.9%, respectively.
The sales area of new commercial housing reached 52.8607 million square meters, an increase of 0.5% over the previous year; the sales volume of new commercial housing reached 429.652 billion yuan, a decrease of 6.9%.
Figure 4 Proportion of investment in the three industries in the province in fixed assets (excluding farmers) in 2024
There were 1,184 major projects with a total planned investment of more than 1 billion yuan, and the completed investment increased by 10.6%.
V. Domestic trade
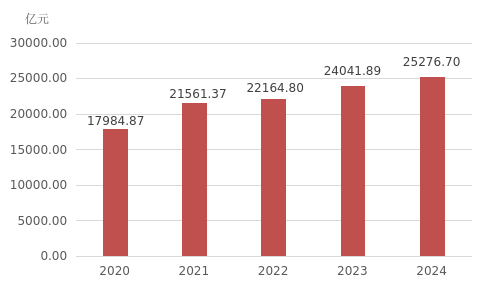
The total retail sales of consumer goods in the province reached 2,527.67 billion yuan, marking a 5.1% increase from the previous year. By location, urban retail sales amounted to 2,168.98 billion yuan, up 5.1%; rural retail sales were 358.687 billion yuan, up 5.2%. By consumption type, retail sales of goods reached 2,148.892 billion yuan, up 4.5%; catering revenue was 378.778 billion yuan, up 8.9%.
Figure 5 Total retail sales of consumer goods in Hubei Province from 2020 to 2024
Online retail sales increased by 19.0% over the previous year. Among them, online retail sales of physical goods increased by 19.7%, accounting for 18.2% of total retail sales of consumer goods.
6. Foreign economy
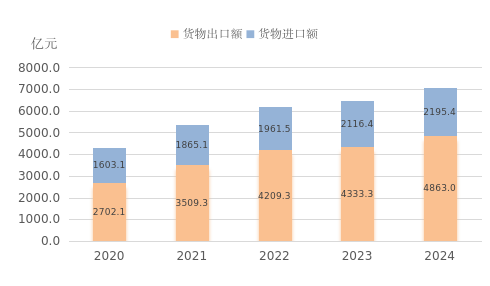
The province's total import and export value of goods reached 705.84 billion yuan, marking a 9.6% increase from the previous year. Specifically, imports amounted to 219.54 billion yuan, up 3.7%, while exports reached 486.30 billion yuan, up 12.4%. The import and export values with the top three trading partners—ASEAN, the EU, and the US—were 150.33 billion yuan, 81.08 billion yuan, and 69.22 billion yuan, respectively, with growth rates of 38.7%, -1.7%, and 12.1%. The import and export value with RCEP member countries was 229.82 billion yuan, growing by 19.8%, accounting for 32.6% of the total; the import and export value with Belt and Road countries was 376.00 billion yuan, growing by 13.1%, accounting for 53.3% of the total.
Figure 6 Total import and export of goods in the province from 2020 to 2024
Throughout the year, 650 new foreign-invested projects were established. The actual use of foreign direct investment (FDI) was $1.922 billion, a decrease of 29.6% from the previous year. Local enterprises invested $1.61 billion in overseas projects, marking a 2.1% increase. The turnover from completed overseas contracting projects reached $7.53 billion, up 1.7%. A total of 13,940 workers were dispatched for various types of labor services, a 19.6% decrease from the previous year.
Transportation, post and telecommunications
By the end of the year, the total length of highways in the province reached 310,770 kilometers, marking a 1.1% increase from the previous year. The length of expressways increased to 8,124 kilometers, up by 3.5%. Throughout the year, the freight turnover reached 908.239 billion ton-kilometers, up by 5.7%; the passenger turnover was 110.588 billion person-kilometers, up by 7.6%; and the port handled 753 million tons of cargo, up by 8.6%. The port container throughput was 2.6066 million TEUs, down by 21.0%.
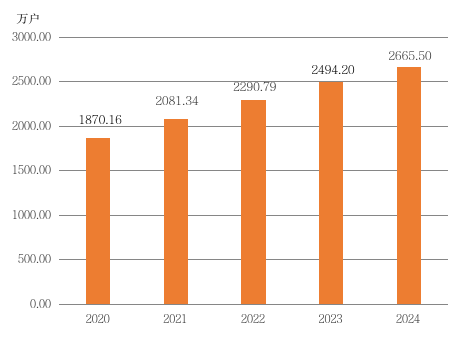
The postal industry achieved a total business volume of 64.173 billion yuan, marking a 29.7% increase from the previous year. Specifically, the express delivery volume reached 5.634 billion items, generating a revenue of 37.513 billion yuan. The telecommunications industry saw a total business volume of 61.881 billion yuan, up 13.6% from the previous year. The length of long-distance optical cable lines reached 37,500 kilometers; there were 4.149 million fixed telephone users; and 65.233 million mobile phone users (excluding data from radio and television networks). The mobile phone penetration rate was 113.0 units per 100 people. Fixed broadband internet access users reached 26.655 million, an increase of 1.713 million from the previous year. Mobile internet user traffic reached 11.68 billion GB, up 16.9% from the previous year.
Figure 7. Express delivery volume and growth rate in the province from 2020 to 2024
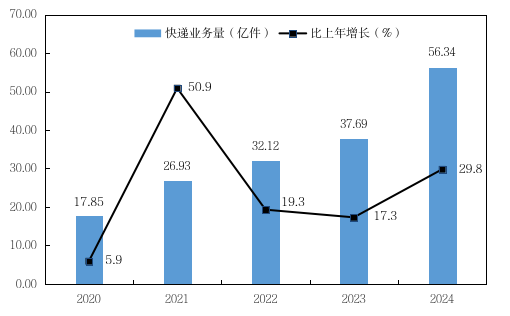
Note: In 2024, some postal and express delivery enterprises will adjust the scope of express delivery business, and the growth rate of express delivery business will be calculated according to the comparable scope.
Figure 8 Number of fixed Internet broadband users at the end of 2020-2024 in the province
VIII. Finance and finance
The total fiscal revenue of the province reached 656.948 billion yuan, an increase of 3.6% over the previous year. Of this, local general public budget revenue reached 393.705 billion yuan, up 6.6%; local general public budget expenditure reached 997.411 billion yuan, up 7.3%.
By the end of the year, the total balance of domestic and foreign currency deposits in financial institutions across the province reached 94021.76 billion yuan, an increase of 6894.55 billion yuan from the beginning of the year. Household deposits amounted to 59053.99 billion yuan, up by 6122.94 billion yuan. The total balance of domestic and foreign currency loans in financial institutions reached 87113.01 billion yuan, an increase of 5745.00 billion yuan from the beginning of the year. Household loans amounted to 24029.93 billion yuan, up by 715.91 billion yuan; loans to non-financial enterprises and government agencies amounted to 62373.05 billion yuan, up by 5126.72 billion yuan.
The total premium income for the year reached 225.073 billion yuan, marking a 6.3% increase from the previous year. Specifically, the premium income from property insurance was 48.79 billion yuan, up 5.4%; and the premium income from life insurance was 176.283 billion yuan, up 6.5%. The total compensation and payments amounted to 95.691 billion yuan, a 25.7% increase, with property insurance compensation expenses reaching 34.153 billion yuan, up 10.0%, and life insurance compensation expenses reaching 61.537 billion yuan, up 36.6%.
Education and science and technology
Throughout the year, the province admitted 600,200 students to undergraduate and junior college programs, with 1,915,200 students currently enrolled and 509,600 graduates. Additionally, 77,200 students were admitted to graduate programs, with 242,100 students currently enrolled and 63,500 graduates. Furthermore, 197,300 students were enrolled in various secondary vocational education programs, with 543,300 students currently enrolled and 181,600 graduates. The province also admitted 395,200 students to high schools, with 1,119,700 students currently enrolled and 332,100 graduates. There were 1,930,300 students in junior high schools, 3,820,100 students in primary schools, and 1,340,700 children in kindergartens.
A total of 2,454 major scientific and technological achievements were registered throughout the year, including 58 basic theoretical achievements, 2,339 applied technological achievements and 57 soft science achievements. A total of 70,327 technology contracts were signed throughout the year, with a turnover of 550.429 billion yuan, an increase of 14.6% over the previous year.
By the end of the year, the province had built 397 provincial engineering research centers and 803 provincial enterprise technology centers.
By the end of the year, there were 1,770 inspection and testing institutions in The province, 35 national quality inspection centers, 125,384 valid certification certificates issued, 35,413 organizations certified, and 3,182 public measurement standards established. 1.75 million measuring instruments were inspected throughout the year.
At the end of the year, there were 26 weather radar observation stations and 18 satellite cloud map receiving stations in the province. There were 3 seismic telemetry network and 54 seismic stations.
Culture, health and sports
By the end of the year, the province had 89 state-owned art performance groups, 127 cultural and art centers, 119 public libraries, and 240 museums. There were 116 film screening management institutions and 2,049 screening units. The province had 12 radio and television stations, 1 radio station, 1 TV station, 72 media convergence centers, and 12.9693 million cable TV subscribers. The comprehensive population coverage rate for radio programs was 99.91%, and for TV programs, it was 99.89%. Throughout the year, 510 million newspapers, 60 million journals, and 370 million books were published. The revenue of large-scale cultural and related industry enterprises reached 527.3 billion yuan, marking a 9.9% increase from the previous year.
By the end of the year, the province had a total of 38,659 healthcare institutions, including 1,268 hospitals, 36,805 primary healthcare facilities, and 447 specialized public health institutions. There were 511,200 health professionals, including 196,400 practicing (assistant) physicians and 239,200 registered nurses. The total number of beds in healthcare institutions was 489,800, with 356,000 in hospitals, 19,100 in community health service centers, and 93,600 in health clinics. Throughout the year, there were 386,120,000 outpatient visits and 15,250,000 hospital discharges.
Throughout the year, athletes from the province won 101 championships, 60 second places and 38 third places in international competitions; in various national competitions, they won 217 championships, 187 second places and 227 third places. The annual sales of sports lottery reached 17.932 billion yuan.
Population, living standards and social security
At the end of the year, the permanent resident population of the province was 58.34 million, including 38.71 million in urban areas and 19.63 million in rural areas. The urbanization rate reached 66.35%. The annual birth population was 314,000, with a birth rate of 5.38 per thousand; the death population was 497,000, with a death rate of 8.52 per thousand, and the natural population growth rate was-3.14 per thousand.
The per capita disposable income of residents across the province reached 36,947 yuan, marking a 5.1% increase from the previous year. By urban and rural areas, the per capita disposable income for urban residents was 46,987 yuan, up 4.4%; for rural residents, it was 22,580 yuan, up 6.0%. The per capita living consumption expenditure of residents across the province was 27,888 yuan, up 2.9%. By urban and rural areas, the per capita living consumption expenditure for urban residents was 32,473 yuan, up 3.1%; for rural residents, it was 21,326 yuan, up 1.9%.
By the end of the year, 20,739,200 people in the province were enrolled in the basic old-age insurance for urban employees, including 13,804,900 active employees and 6,934,300 retirees; 24,902,200 people were enrolled in the basic old-age insurance for urban and rural residents; 13,675,700 people were enrolled in the basic medical insurance for employees; 41,846,300 people were enrolled in the basic medical insurance for urban and rural residents; 9,449,300 people were enrolled in work injury insurance; 8,055,100 people were enrolled in maternity insurance; 7,673,800 people were enrolled in unemployment insurance, with 285,700 receiving unemployment benefits by the end of the year.
At the end of the year, 226,200 urban residents and 1,229,100 rural residents were provided with subsistence allowances, and 381,500 people received state compensation and subsidies. There were 296,700 beds in nursing homes. The annual sales of social welfare lotteries reached 7.541 billion yuan.
12. Energy conservation and consumption reduction, resources and environment
Throughout the year, energy consumption per unit of GDP in the province continued to decline.
The total supply of state-owned construction land was 25,800 hectares, down 15.7 percent from the previous year. Water consumption per 10,000 yuan of GDP was 48 cubic meters, down 5.0 percent from the previous year. Water consumption per 10,000 yuan of industrial added value was 24 cubic meters, down 6.9 percent from the previous year.
In the whole year, 222,300 hectares of forest were planted, including 60,200 hectares of artificial afforestation, accounting for 27.08% of the total afforestation area. The forest tending area was 580,800 hectares. By the end of the year, there were 22 national nature reserves in the province.
Of the 275 surface water quality monitoring sections of the main rivers in the province, 97.1% were rated as Class I to III throughout the year, while 2.9% were rated as Class IV or V, with no water bodies classified as worse than Class V. Among the 51 water areas of the main lakes and reservoirs in the province, 74.5% were rated as Class I to III, while 25.5% were rated as Class IV or V, with no water bodies classified as worse than Class V.
Of the 13 cities at or above the prefecture level monitored in the province, 38.5 percent met air quality standards for the year, while 61.5 percent did not. The average annual concentration of fine particulate matter (PM2.5) in cities that failed to meet the standards was 40 micrograms per cubic meter, down 2.4 percent from the previous year.
explanatory note :
1. The data in this bulletin in 2024 are statistical express numbers. According to the results of the fifth national economic census, the historical data of relevant indicators such as regional GDP, three industries and added value of related industries have been revised.
2. The absolute value of GDP and added value of each industry shall be calculated at current prices, and the growth rate shall be calculated at constant prices.
3. The total business volume of the postal industry shall be calculated at the constant unit price in 2020, and the total business volume of the telecommunications industry shall be calculated at the constant unit price in 2023.
4. The number of permanent residents at the end of the year is the sum of the number of permanent residents at the end of the previous year and the number of natural growth population and mechanical growth population in this year. The number of natural growth population in this year is equal to the difference between the number of births and deaths in this year, and the number of mechanical growth population in this year is equal to the difference between the number of migrants in and out of this year.
data source :
The data on new urban employment, old-age insurance, work injury insurance, and unemployment insurance in this bulletin are provided by the Provincial Department of Human Resources and Social Security. The aquatic product data is from the Provincial Department of Agriculture and Rural Affairs. The data on goods import and export are from Wuhan Customs. The data on actual foreign investment, outward direct investment, overseas contracting projects, and overseas labor cooperation are from the Provincial Department of Commerce. The data on public libraries, cultural centers, museums, and art performance groups are from the Provincial Department of Culture and Tourism. The data on cargo turnover, passenger turnover, total road mileage, highway mileage, port cargo throughput, and container throughput are from China State Railway Group Co., Ltd., the Provincial Department of Transportation, China Southern Airlines Hubei Branch, China Eastern Airlines Wuhan Branch, and Air China Hubei Branch. The data on postal business volume, express delivery business volume, and express delivery business income are from the Provincial Postal Administration. The data on telecommunications business volume, long-distance optical cable lines, telephone users, Internet users, and mobile phone penetration rate are from the Provincial Communications Administration. The financial data is from the Provincial Finance Department. The financial data is from the People's Bank of China Wuhan Branch. The premium data is from the Hubei Financial Regulatory Bureau. The education data is from the Provincial Department of Education. The health institutions and beds data are from the Provincial Health Commission. The radio and television data is from the Provincial Radio and Television Bureau. The film and publishing data is from the Provincial Publicity Department of the CPC Committee. The sports and sports lottery data are from the Provincial Sports Bureau. The low-income assistance, social services, and welfare lottery data are from the Provincial Civil Affairs Department. The national compensation and subsidy for preferential treatment recipients data is from the Provincial Veterans Affairs Department. The medical insurance and maternity insurance data are from the Provincial Medical Insurance Bureau. The provincial engineering research center and provincial enterprise technology center data are from the Provincial Development and Reform Commission. Data on major scientific and technological achievements, technical contracts, etc., are provided by the Provincial Department of Science and Technology. Data on business entities, inspection and testing institutions, quality inspection centers, organizations that have been issued valid certification certificates, certified organizations, the establishment of public metrological standards, and mandatory verification of measuring instruments are provided by the Provincial Market Supervision Administration. Earthquake data is provided by the Provincial Seismological Bureau. Land use data is provided by the Provincial Department of Natural Resources. Water resources data is provided by the Provincial Water Resources Department. Forest resources and nature reserves data are provided by the Provincial Forestry Bureau. Environmental monitoring data is provided by the Provincial Department of Ecology and Environment. Data on prices, grain, livestock, urban and rural unemployment rates, and residents' income and expenditure are provided by the Hubei Investigation Team of the National Bureau of Statistics. Other data are provided by the Provincial Bureau of Statistics.
 ChinaCensus
 Hubei Province 2024 National Economic and Social Development Statistical Bulletin