Area: China > Shanghai China Area Ranking
-Guangdong
-Shandong
-Henan
-Jiangsu
-Sichuan
-Hebei
-Zhejiang
-Hunan
-Anhui
-Hubei
-Guangxi
-Yunnan
-Jiangxi
-Fujian
-Liaoning
-Shaanxi
-Guizhou
-Shanxi
-Chongqing
-Heilongjiang
-Xinjiang
-Shanghai
-Gansu
-Inner Mongolia
-Jilin
-Beijing
-Tianjin
-Hainan
-Ningxia
-Qinghai
-Xizang(Tibet)
Dependency Administrative region under Shanghai -Jinshan
-Pudong
-Minhang
-Baoshan
-Songjiang
-Jiading
-Yangpu
-Putuo
-Qingpu
-Fengxian
-Xuhui
-Jingan
-Hongkou
-Chongming
-Changning
-Huangpu
LATEST POPULATION AND ECONOMIC BRIEF DATA
24.8026 Mil. E 2025 Resident Population
14.9677 Mil.
E 2025 Registered Population
Rank22 Rank at China
6340.5km²
Land Area
3912/km²
Population density
$757.22B
2024 GDP
$13072.02
2024 Urban HDI
$6409.14
2024 Rural HDI
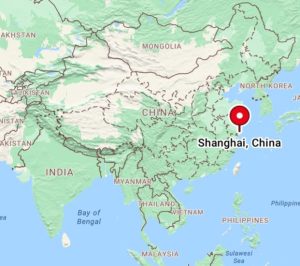
BASIC INFORMATION Shanghai positon
Shanghai, also known as Hu, is a municipality directly under the Central Government of the People's Republic of China. It is located in the east China region of China, on the western shore of the Pacific Ocean and along the eastern edge of Asia.
It is part of the Yangtze River Delta alluvial plain, located between 120°52′-122°12′E and 30°40′-31°53′N. The average elevation of Shanghai is 2.19 meters, with Mount Dajin being the highest point in Shanghai at an elevation of 103.7 meters. It belongs to the subtropical monsoon climate.
POPULATION CHANGE CHART IN RECENT YEARS 123
Indicator 2024 2023 2022 Resident Pop (10k) 2480.26 2487.45 2475.89 Urbanization Rate (%) 89.85 89.46 - Urban Pop (10k) 2228 2225 - Rural Pop (10k) 252 262 - Registered (10k) - 578.52 573.05 Registered Pop (10k) 1496.77 1516.39 1503.83 Registered Male (10k) - 746.91 742.39 Registered Female (10k) - 769.49 761.43 Registered Age 0-17 - 194.8 - Registered Age 18-34 - 215.87 - Registered Age 35-59 - 539.01 - Registered Over 60 (Hukou) - 566.71 - Births (10k) 11.8 9.8 - Deaths (10k) 15.6 15.8 - Birth Rate (‰) 4.75 3.95 - Death Rate (‰) 6.28 6.37 - Natural Growth (‰) -1.53 -2.42 -
THE BRIEF DATA OF THE RECENT THREE CENSUSES
Index 7th Census (2020) 6th Census (2010) 5th Census (2000) Resident Population 24870895 23019196 16407734 Urban Population 22209380 20555098 14489919 Urbanization Rate 89.3% 89.3% 88.31% Female 12875211 11854916 8430262 Male 11995684 11164280 7977472 Male to female ratio 107.33 106.19 105.68 Proportion of ethnic minorities 1.61 1.20 0.63 Number of households 9644628 8253257 5299068 Family Size 22347586 20593430 14787225 Household size (person/household) 2.32 2.50 2.79
CENSUS AGE PYRAMID LOCAL ETHNIC COMPOSITION
7TH CENSUS ETHNIC COMPOSITION
ETHNIC
POPULATION
FEMALE
MALE
PROPORTION
Population
24870895
12875211
11995684
100%
other ethnic
0
0
0
0%
Han
24471085
12671742
11799343
98.3924583%
Mongolian
21097
10297
10800
0.0848261%
Hui
84925
42842
42083
0.3414634%
Tibetan
5749
2438
3311
0.0231154%
Uygur
10039
4738
5301
0.0403645%
Miao
38916
21447
17469
0.1564721%
Yi
21952
12388
9564
0.0882638%
Zhuang
27531
13182
14349
0.1106957%
Buyei
9914
5134
4780
0.0398619%
Korean
25404
11559
13845
0.1021435%
Manchu
43197
20733
22464
0.1736849%
Dong
11870
6375
5495
0.0477265%
Yao
6309
3144
3165
0.025367%
Bai
7299
3780
3519
0.0293476%
Tujia
41807
21879
19928
0.1680961%
Hani
8573
5037
3536
0.03447%
Kazak
1695
671
1024
0.0068152%
Dai
3445
1874
1571
0.0138515%
Li
3192
1386
1806
0.0128343%
Lisu
1619
909
710
0.0065096%
Wa
2888
1801
1087
0.011612%
She
4476
2332
2144
0.0179969%
Gaoshan
89
37
52
0.0003578%
Lahu
1234
686
548
0.0049616%
Shui
1215
636
579
0.0048852%
Dongxiang
1078
709
369
0.0043344%
Naxi
532
270
262
0.002139%
Jingpo
598
324
274
0.0024044%
Kirgiz
196
68
128
0.0007881%
Tu
603
307
296
0.0024245%
Daur
879
402
477
0.0035343%
Mulao
1140
573
567
0.0045837%
Qiang
821
404
417
0.003301%
Blang
315
186
129
0.0012665%
Salar
1361
806
555
0.0054723%
Maonan
349
167
182
0.0014032%
Gelao
3138
1839
1299
0.0126172%
Xibe
1181
515
666
0.0047485%
Achang
232
122
110
0.0009328%
Pumi
65
36
29
0.0002613%
Tajik
48
24
24
0.000193%
Nu
44
22
22
0.0001769%
Uzbek
50
21
29
0.000201%
Russia
286
114
172
0.0011499%
Ewenki
126
54
72
0.0005066%
Deang
70
37
33
0.0002815%
Baoan
32
19
13
0.0001287%
Yugu
44
22
22
0.0001769%
Jing
49
22
27
0.000197%
Tatar
13
8
5
5.23E-5%
Dulong
11
2
9
4.42E-5%
Oroqen
81
29
52
0.0003257%
Hezhe
50
23
27
0.000201%
Monba
25
6
19
0.0001005%
Lhoba
6
4
2
2.41E-5%
Jinuo
46
18
28
0.000185%
Undetermined ethnic group
1775
928
847
0.0071369%
Naturalization
131
83
48
0.0005267%

 Hubei Province 2024 National Economic and Social Development Statistical Bulletin